The YData Profiling package generates an exploratory data analysis (EDA) report with a few lines of code. The report provides dataset and column-level analysis, including plots and summary statistics to help you quickly understand your dataset. These reports can be exported to HTML or JSON so you can share them with other stakeholders.
By the end of this tutorial, you’ll understand that:
- YData Profiling generates interactive reports containing EDA results, including summary statistics, visualizations, correlation matrices, and data quality warnings from DataFrames.
ProfileReportcreates a profile you can save with.to_file()for HTML or JSON export, or display inline with.to_notebook_iframe().- Setting
tsmode=Trueand specifying a date column withsortbyenables time series analysis, including stationarity tests and seasonality detection. - The
.compare()method generates side-by-side reports highlighting distribution shifts and statistical differences between datasets.
To get the most out of this tutorial, you’ll benefit from having knowledge of pandas.
Note: The examples in this tutorial were tested using Python 3.13. Additionally, you may need to install setuptools<81 for backward compatibility.
You can install this package using pip:
$ python -m pip install ydata-profiling
Once installed, you’re ready to transform any pandas DataFrame into an interactive report. To follow along, download the example dataset you’ll work with by clicking the link below:
Get Your Code: Click here to download the free sample code and start automating Python data analysis with YData Profiling.
The following example generates a profiling report from the 2024 flight delay dataset and saves it to disk:
flight_report.py
import pandas as pd
from ydata_profiling import ProfileReport
df = pd.read_csv("flight_data_2024_sample.csv")
profile = ProfileReport(df)
profile.to_file("flight_report.html")
This code generates an HTML file containing interactive visualizations, statistical summaries, and data quality warnings:
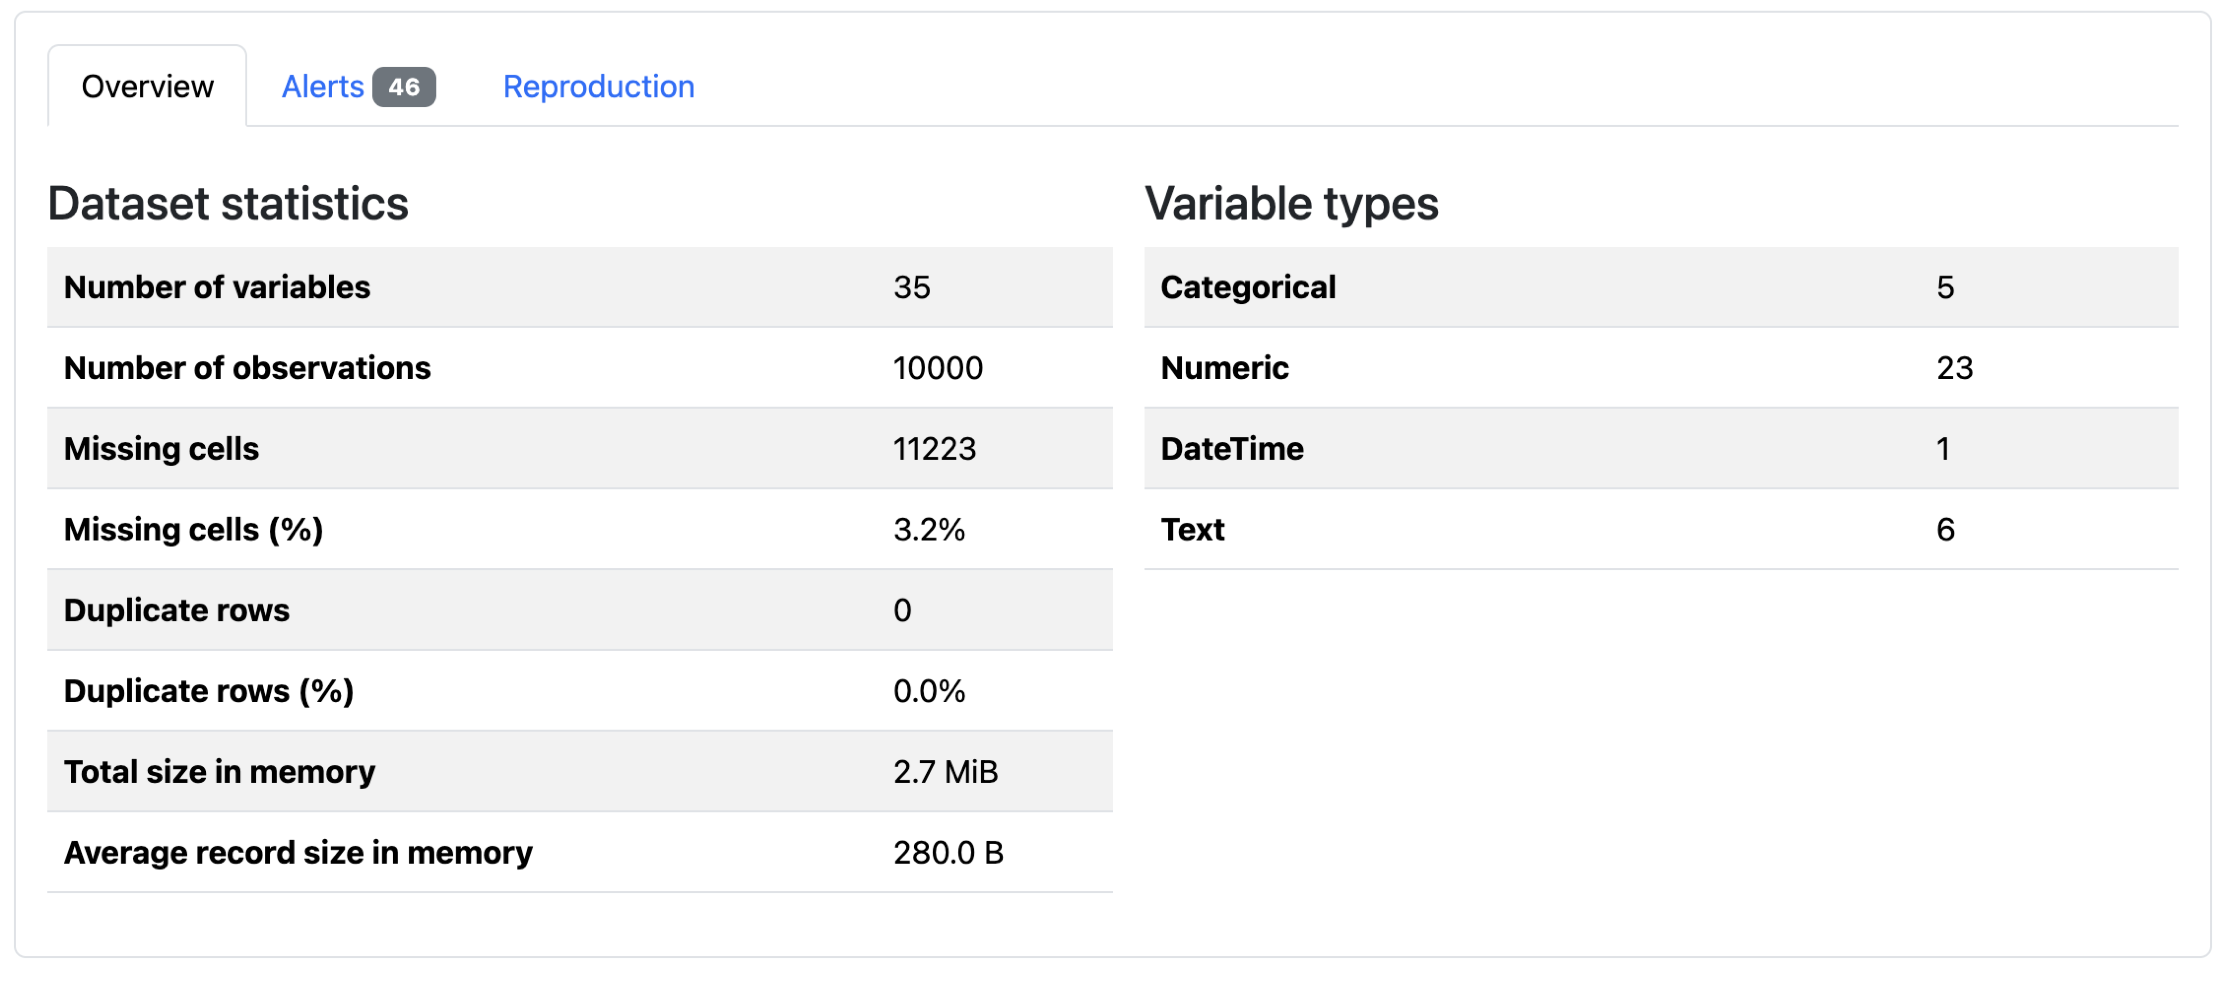
You can open the file in any browser to explore your data’s characteristics without writing additional analysis code.
There are a number of tools available for high-level dataset exploration, but not all are built for the same purpose. The following table highlights a few common options and when each one is a good fit:
| Use case | Pick | Best for |
|---|---|---|
| You want to quickly generate an exploratory report | ydata-profiling |
Generating exploratory data analysis reports with visualizations |
| You want an overview of a large dataset | skimpy or df.describe() |
Providing fast, lightweight summaries in the console |
| You want to enforce data quality | pandera |
Validating schemas and catching errors in data pipelines |
Overall, YData Profiling is best used as an exploratory report creation tool. If you’re looking to generate an overview for a large dataset, using SkimPy or a built-in DataFrame library method may be more efficient. Other tools, like Pandera, are more appropriate for data validation.
If YData Profiling looks like the right choice for your use case, then keep reading to learn about its most important features.
Take the Quiz: Test your knowledge with our interactive “Automate Python Data Analysis With YData Profiling” quiz. You’ll receive a score upon completion to help you track your learning progress:

Interactive Quiz
Automate Python Data Analysis With YData ProfilingTest your knowledge of YData Profiling, including report creation, customization, performance optimization, time series analysis, and comparisons.
Building a Report With YData Profiling
Read the full article at https://realpython.com/ydata-profiling-eda/ »
[ Improve Your Python With 🐍 Python Tricks 💌 – Get a short & sweet Python Trick delivered to your inbox every couple of days. >> Click here to learn more and see examples ]